



Windows Security Case Study Part 2: What Volt Typhoon Behavior Reveals
A Volt Typhoon case study shows how high ATT&CK technique coverage can mask gaps in implementation coverage and the robustness and precision …
By Bryan Hsu and Antonia Feffer • November 10, 2026

In part 1 of our blog series on the myths of detection coverage, we examined Windows and Sysmon detection analytics and showed that “coverage” doesn’t always mean you’re covered. In part 2 (below), we apply the same Summiting the Pyramid methodology to see how well Windows Security and Sysmon logs can detect a well-known adversary.
Volt Typhoon offers a particularly interesting test for detection coverage. Much of the activity described in public reporting does not depend on obviously malicious executables or noisy exploitation after initial access. Instead, the actor has relied on legitimate accounts, familiar administrative tools, and careful exploration of victim environments. Those behaviors leave traces, but finding them and distinguishing them from ordinary administrative actions is a complex problem.
That raises a question we wanted to put to the Detection Coverage Calculator (DCC): when a detection is mapped to an ATT&CK technique associated with Volt Typhoon, how much of the behavior underneath that technique can it actually detect, and how strong are the analytics providing that coverage?
We started with 47 Windows-relevant ATT&CK technique and sub-technique IDs associated with Volt Typhoon, using ATT&CK v19, and selected 773 public Sigma analytics with matching Windows log sources and technique tags. The DCC evaluates coverage against cataloged, behaviorally distinct implementations of a technique.
Five of the 47 techniques had no exact matching tag in the selected Sigma rules, so they did not produce a calculator technique record based on a mapping/selection limitation. This is not proof that those behaviors cannot be detected. The implementation results below therefore refer to the 42 represented techniques.
At the technique level, the results looked reassuring: 40 of 42 represented techniques (95.2%) had at least one covered implementation. Looking beneath those technique mappings, 131 of 168 cataloged implementations were covered (78.0%). That leaves 37 distinct execution paths—22.0% of the assessed catalog—without identified analytic coverage.
This is not an argument that a detection must recognize every possible variation of a technique, but a reminder that a single covered implementation is enough to provide a false flag of technique coverage, even when other ways of performing the same behavior remain undetected. Those are very different coverage statements.
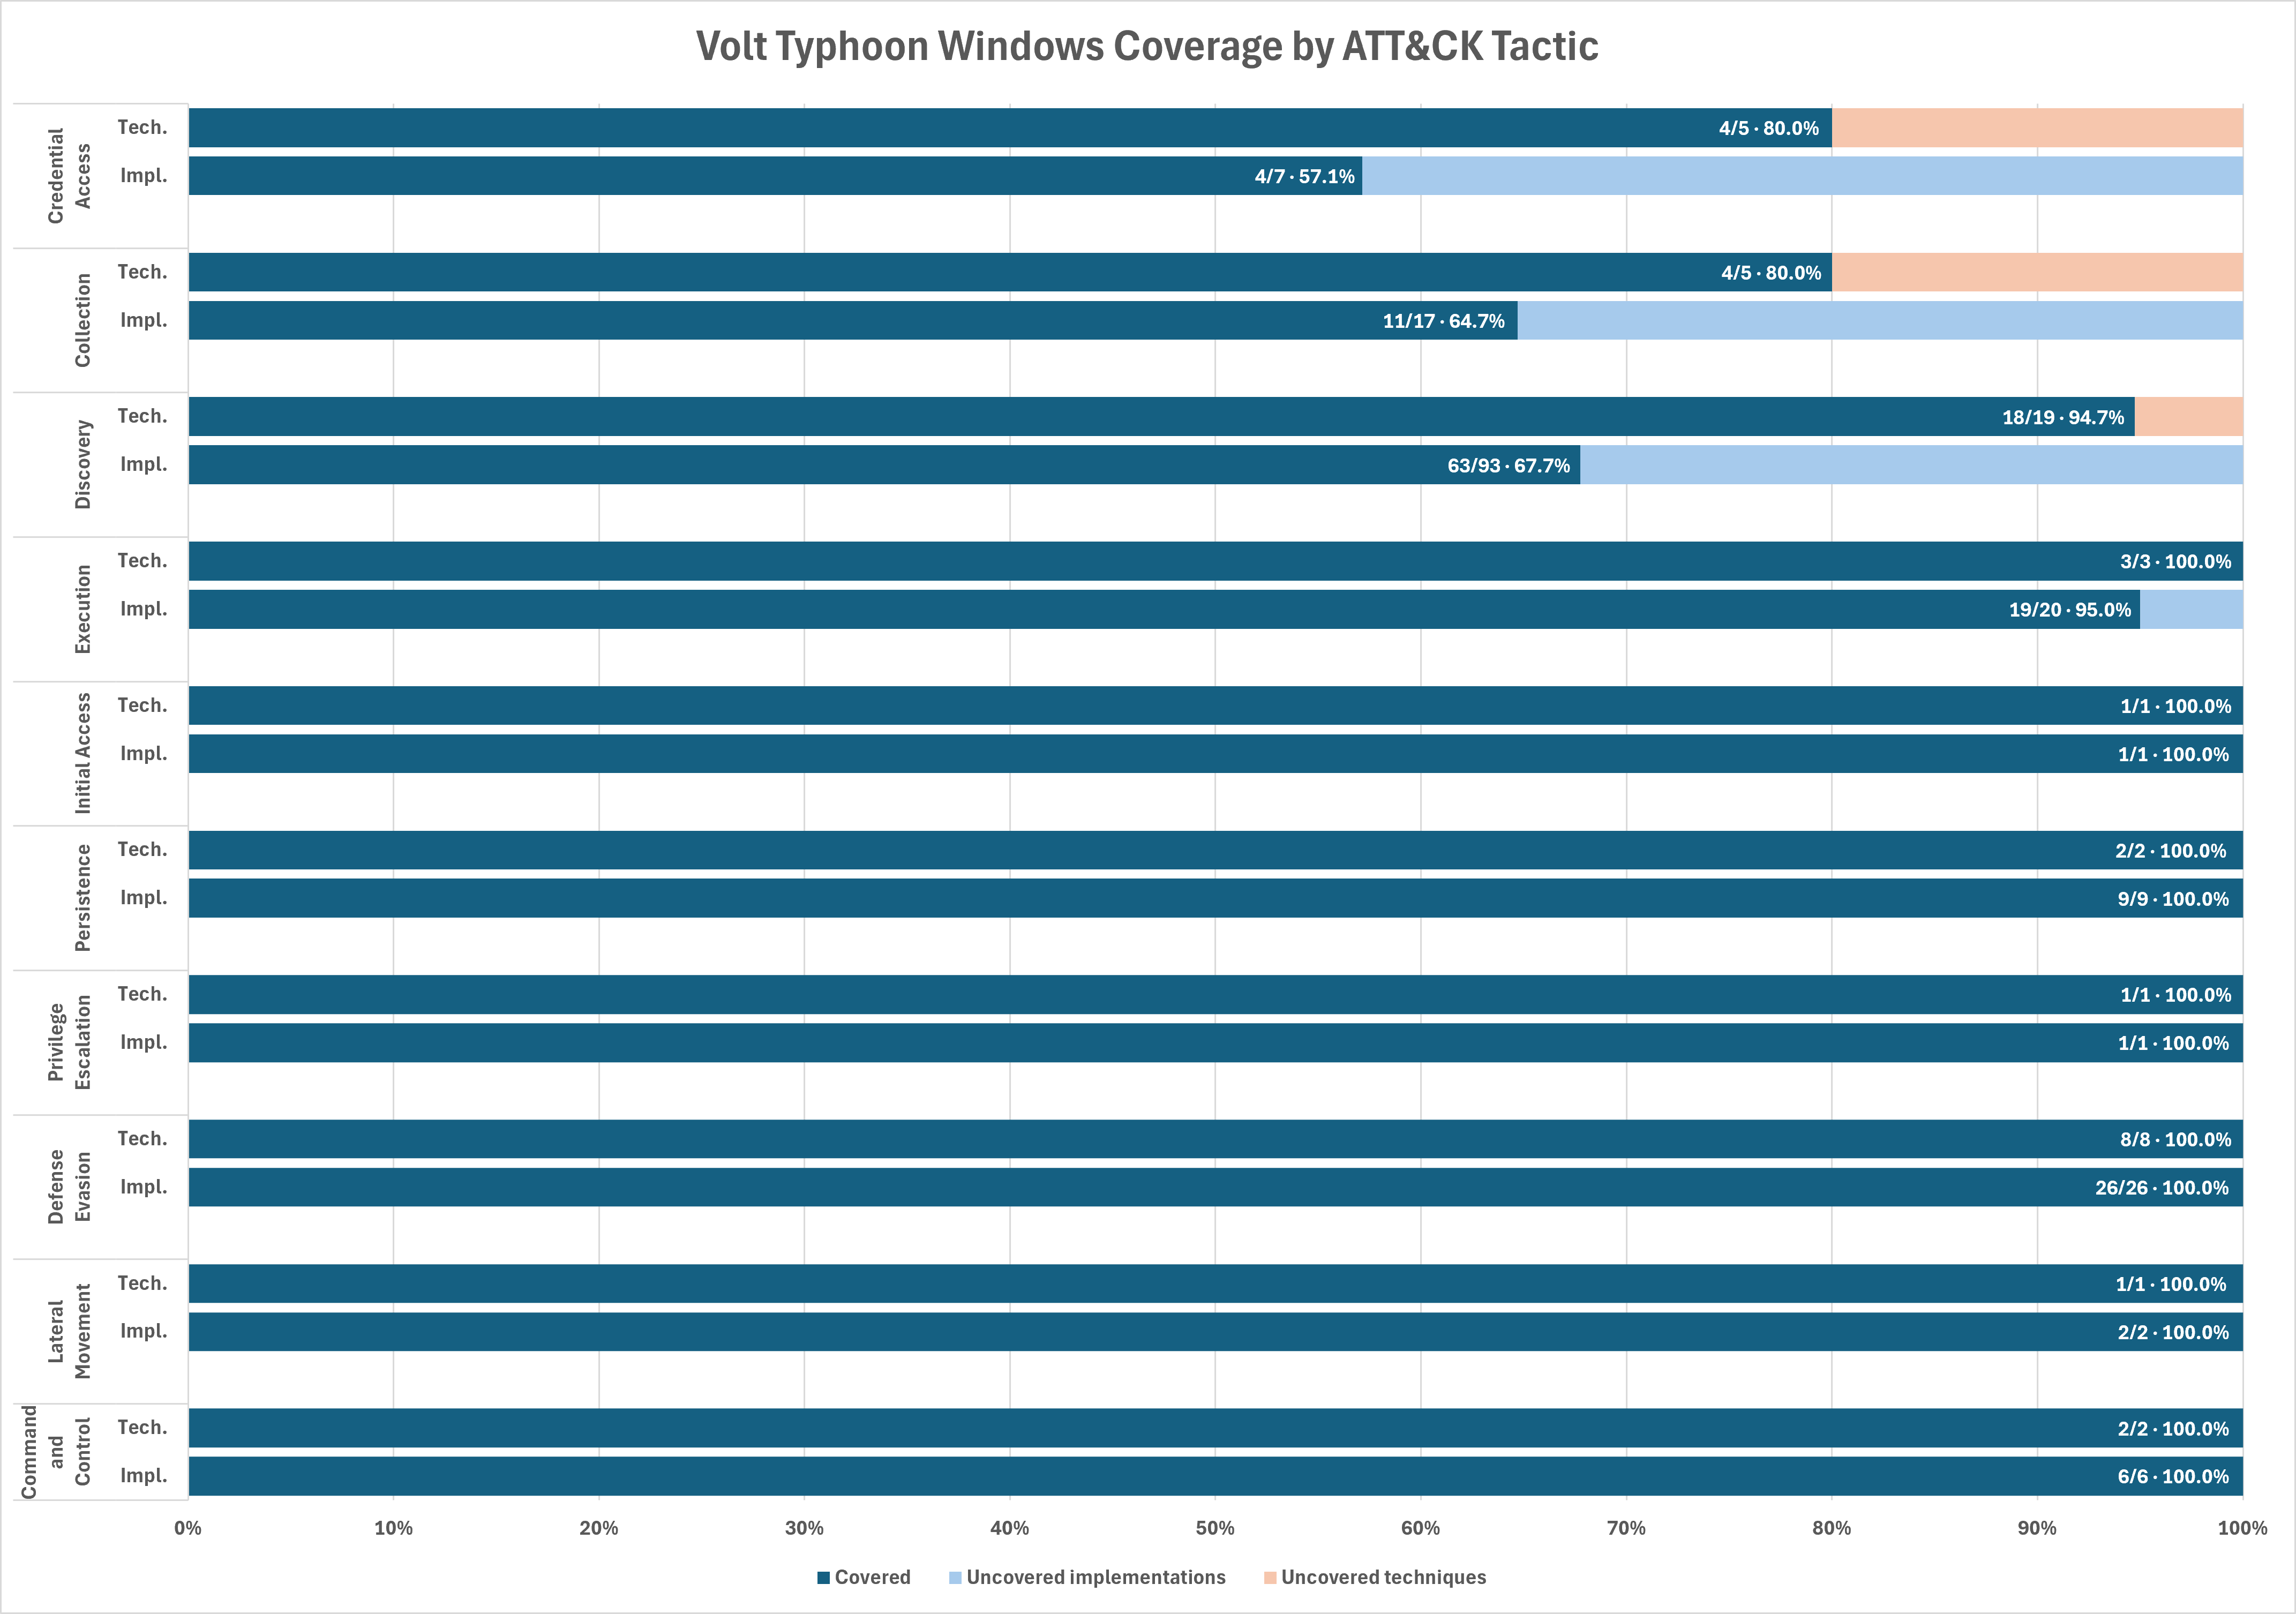
Figure 1. Volt Typhoon Coverage by ATT&CK Tactic for Windows-Based Telemetry. Click to zoom.
Discovery as a tactic stands out in our analysis; although 18 of 19 Discovery techniques had some coverage (94.7%), only 63 of 93 Discovery implementations were covered (67.7%). Discovery accounts for 30 of the 37 uncovered implementations across the study. Process Discovery (T1057), for example, was covered for just one of six cataloged implementations.
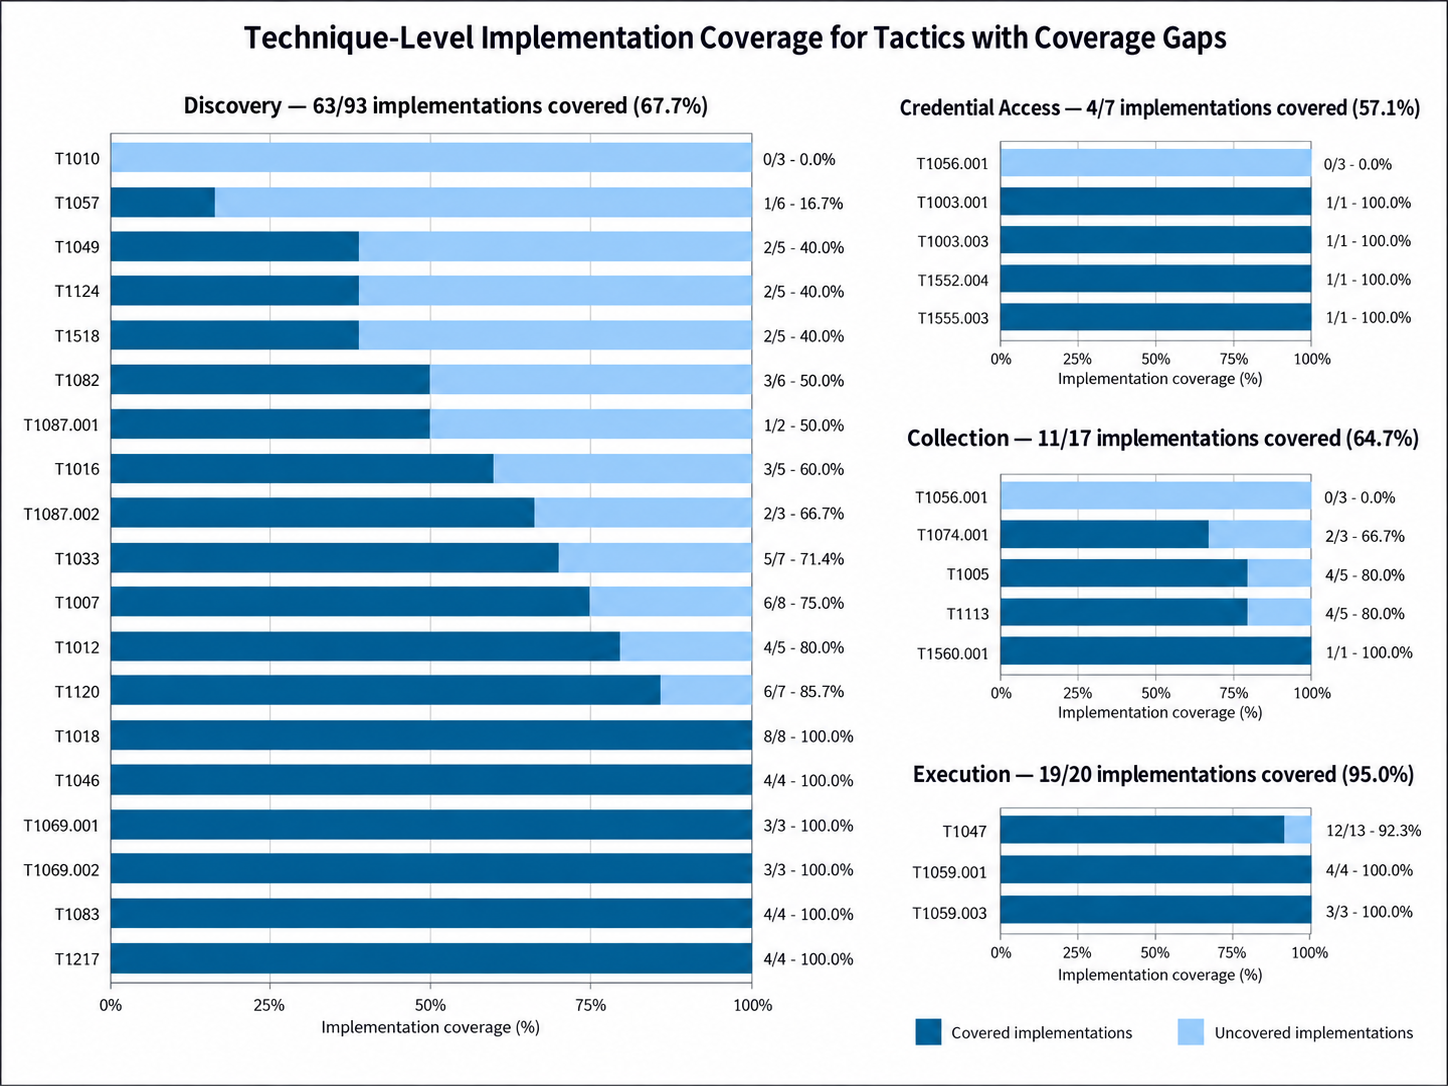
Figure 2. Technique-Level Implementation Coverage for Gaps. Click to zoom.
Discovery is quite significant in Volt Typhoon’s reported operations. Identifying accounts, services, systems, network relationships, and administrative access is part of how the threat actor learns where it can go next and how to remain persistent. A defender might reasonably believe Discovery is well covered by looking at technique mappings, while still missing several of the distinct ways that enumeration can occur.
Credential Access and Collection show similar gaps: 4 of 7 covered implementations (57.1%) and 11 of 17 (64.7%), respectively. These percentages describe the coverage of cataloged implementations within this Windows-focused analytic set and should not be read as the frequency with which Volt Typhoon uses a tactic or as the probability of catching an intrusion.
Some other tactics appear fully covered, but their denominators are much smaller. Initial Access has one assessed implementation and Lateral Movement has two. A 100% result for those narrow subsets is useful, but it is not evidence that every way Volt Typhoon might gain access or move laterally is detectable.
Public reporting on Volt Typhoon consistently emphasizes a pattern of long-term persistence, extensive environment discovery, repeated credential acquisition, and stealthy use of legitimate administrative tools. Lateral movement enables the actor to expand access to additional systems, including domain controllers. While these observations do not establish how frequently each ATT&CK tactic is used, they identify behaviors central to Volt Typhoon’s operating model.
This distinction matters for detection coverage. Discovery and Credential Access are not simply two more tactics on an ATT&CK heatmap; they support the actor’s ability to understand an environment, obtain additional access, and maintain its foothold over time. Gaps in detecting these behaviors may therefore be especially consequential, even when an organization’s overall technique coverage appears strong.
Even when an implementation is covered, the underlying detection may depend on a fragile artifact or a broad signal that also appears in legitimate activity. The DCC’s robustness score addresses how easily an adversary could evade an analytic; its precision score addresses how well the detection distinguishes the behavior of interest from benign activity. These are separate properties, and both matter for a living-off-the-land actor.
The updated analysis scored 713 of the 773 selected analytics for robustness and precision. We also explored what happens when implementation coverage is filtered by analytic-quality thresholds.
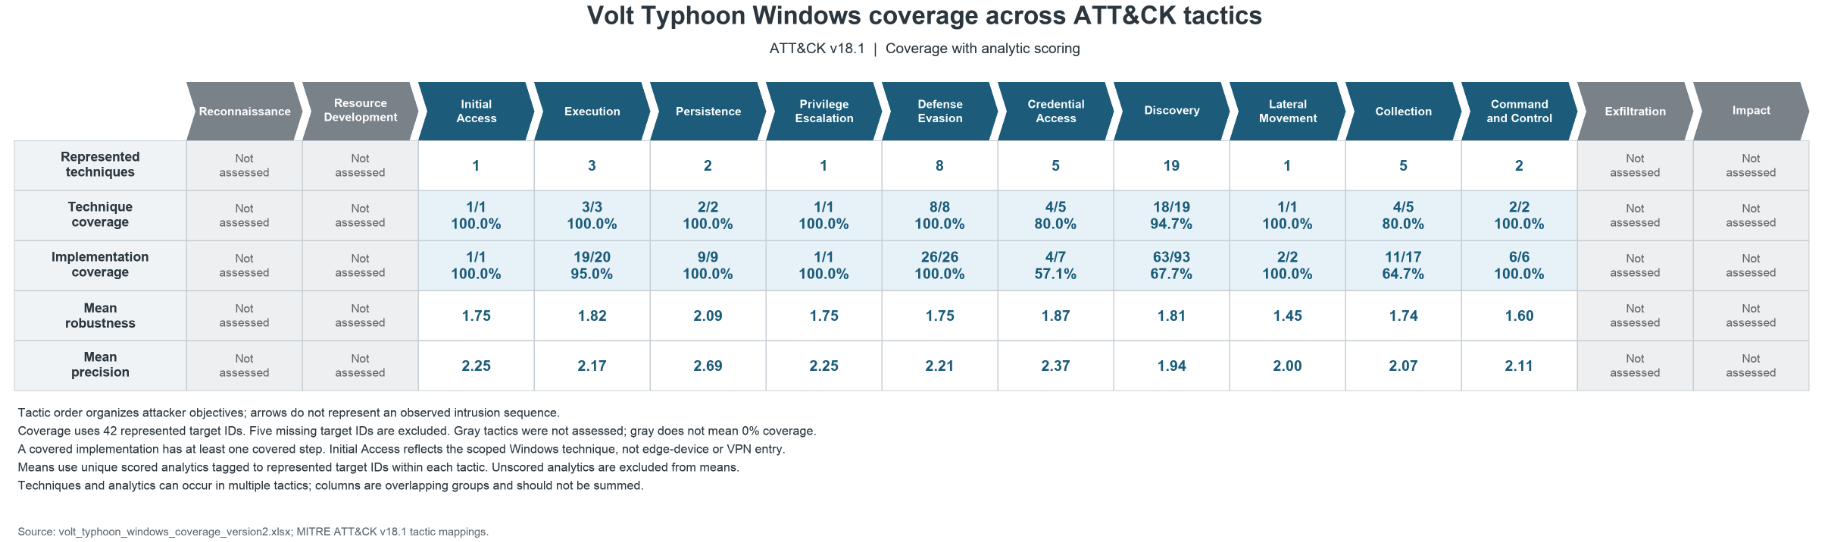
Figure 3. Volt Typhoon Coverage Metrics by Tactic. Click to zoom.
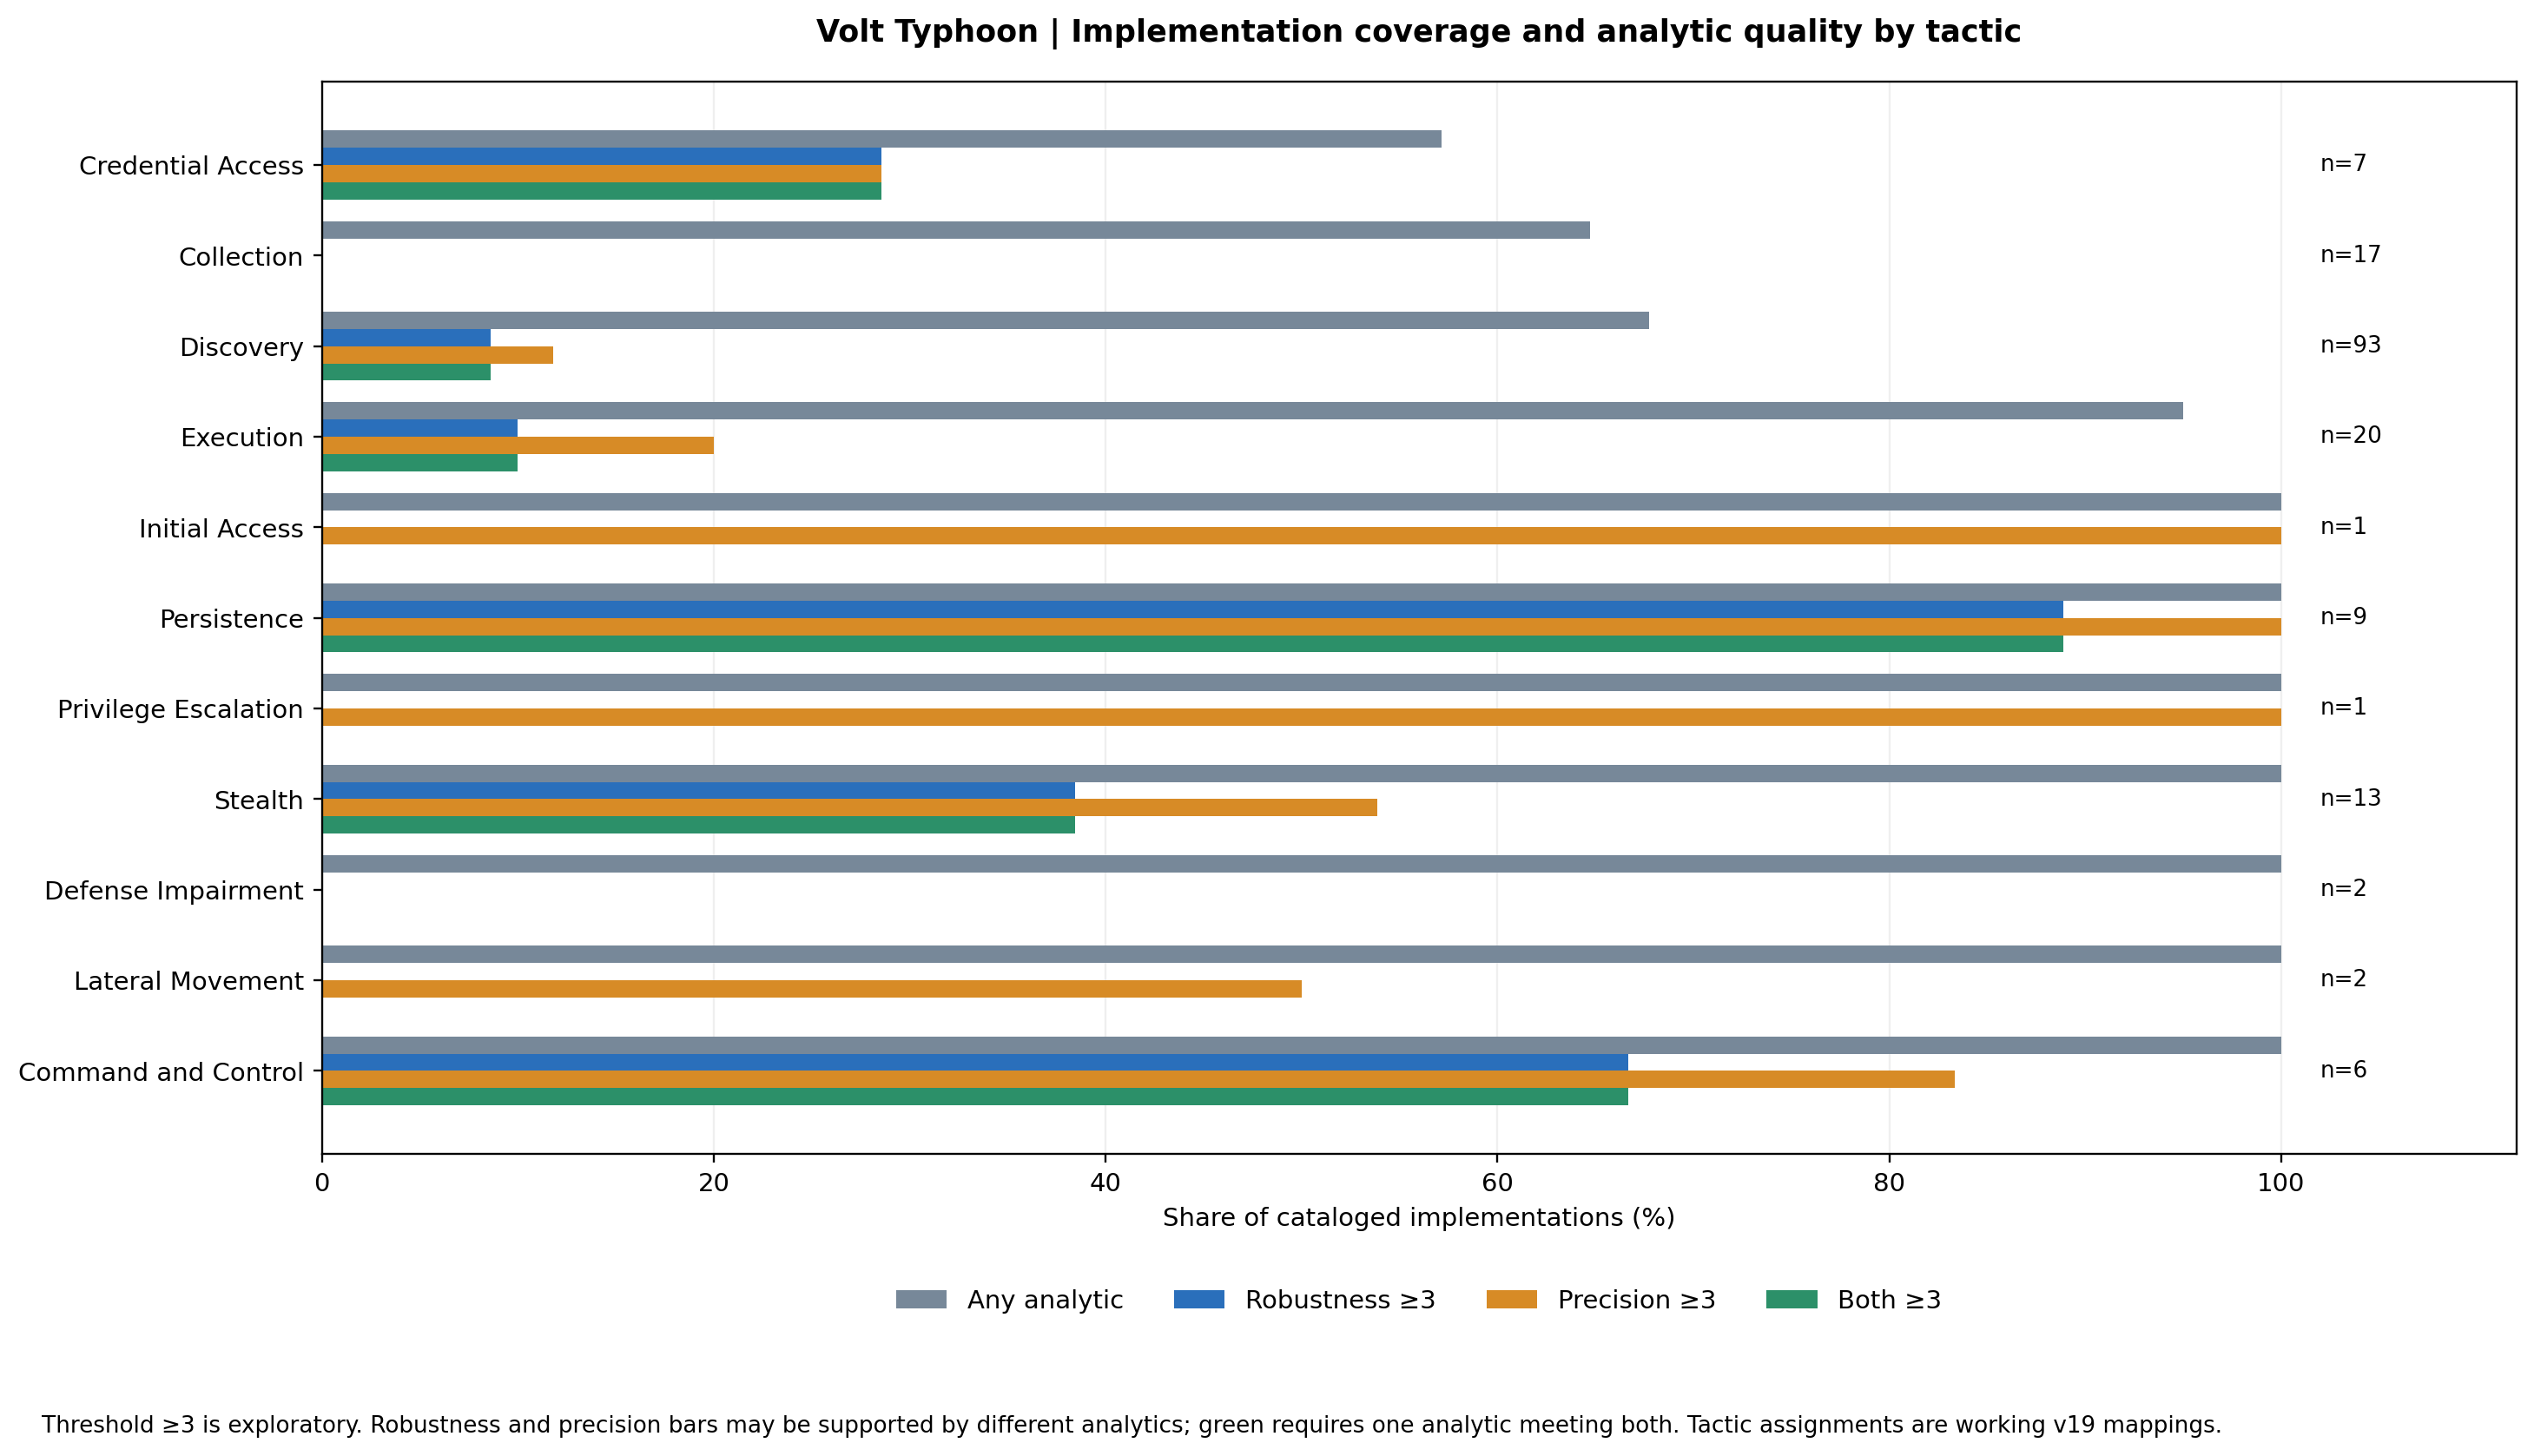
Figure 4. Exploratory tactic-level implementation coverage and quality thresholds. Click to zoom.
Figure 4 above compares ordinary implementation coverage with implementations supported by at least one analytic meeting a robustness threshold, a precision threshold, or both.
The contrast is striking. Across the assessed catalog, 131 of 168 implementations have some coverage, while only 29 of 168 (17.3%) have at least one matched analytic scoring 3 or higher on both robustness and precision in the exploratory join. Discovery illustrates the issue particularly well: its implementation coverage is 67.7%, but its combined high-threshold coverage is much lower. Collection has no implementation meeting the combined threshold in this analysis.
This does not mean that all other analytics are ineffective – a score below 3 may still be operationally valuable, and the threshold is not a pass/fail standard. More importantly, the current join should be validated against step-level analytic mappings before it is used as a definitive quality-adjusted coverage measure. Counting covered implementations and assessing the strength of their supporting analytics should not be treated as interchangeable.
The most important takeaway from this case study is how much the 95.2% technique coverage stat for Volt Typhoon leaves out. When we looked beneath those technique mappings, implementation coverage dropped to 78%, with notable gaps in Discovery, Credential Access, and Collection. Even where implementations were covered, examining the robustness and precision of the underlying analytics revealed concerns of how much confidence we should place in that coverage.
Volt Typhoon‘s reliance on legitimate credentials, native Windows utilities, and living-off-the-land techniques demonstrates how an adversary can pursue its objectives through activity that closely resembles normal system use. A defender might have analytics mapped to nearly every technique the actor uses, but that doesn’t mean those analytics can recognize every way of performing those techniques. Nor does it mean the detections are particularly difficult to evade. An adversary doesn’t need to defeat every detection associated with a technique; it only needs to defeat one. That could mean choosing an uncovered implementation, changing a command or artifact that a brittle analytic depends on, or blending into legitimate activity that generates too much noise to investigate effectively.
This is where we see the real value of combining implementation coverage with detection quality. The Detection Coverage Calculator helps expose gaps hidden within techniques that already appear covered, as well as weaknesses in the robustness and precision of the analytics supporting that coverage. For detection engineers, that provides a much more useful starting point for deciding where to invest effort. An uncovered implementation might point to missing telemetry, overly narrow detection logic, or an incomplete mapping. A covered implementation supported by easily modified indicators might call for more durable behavioral signals, while a low-precision analytic might need additional context to distinguish suspicious activity from routine administration. These are different problems, and understanding which one you’re dealing with matters when deciding how to improve coverage.
This approach also extends well beyond Volt Typhoon. Defenders can apply the same process to other threat actors relevant to their organizations: identify the techniques associated with their operations, evaluate the implementations their existing analytics can detect, examine the quality of those detections, and prioritize the gaps most relevant to the adversary’s objectives. Those findings can then inform targeted adversary emulation to determine whether suspected weaknesses translate into actual detection gaps in their own environments. Repeating the assessment as analytics, telemetry, and adversary behaviors evolve provides a way to measure whether defensive improvements are meaningfully expanding coverage or simply adding more ATT&CK mappings.
Of course, this analysis has boundaries. Our results reflect modeled coverage from a selected set of Windows Sigma analytics, not the likelihood of detecting Volt Typhoon in a production environment. They also do not comprehensively evaluate the edge-device, network, and proxy activity that features prominently in the actor’s operations. But that doesn’t diminish the value of the findings. It helps clarify what the analysis can tell us, what remains outside its scope, and where further validation is needed.
Ultimately, the goal is to understand what an adversary could still do despite those green boxes, how easily existing detections might be evaded, and where defenders can make the greatest improvements. By connecting known adversary behavior with implementation coverage, robustness, and precision, we can move beyond measuring the presence of detections toward understanding how resilient our detection capabilities really are.
© 2026 The MITRE Corporation. Approved for Public Release. ALL RIGHTS RESERVED. Document number
26-0334.

A Volt Typhoon case study shows how high ATT&CK technique coverage can mask gaps in implementation coverage and the robustness and precision …
Explore how CIS Safeguards map to MITRE ATT&CK techniques to assess defensive coverage, identify gaps, and support threat-informed security …
A case study of 144 Sigma analytics using Windows Security log sources shows why ATT&CK mappings alone do not reveal the depth or quality of …